Price Controls#
Price controls are restriction imposed by governments on the price of a certain good or service in market. Usually, the governments impose price controls to maintain the affordability of goods to control inflation, to ensure a minimum income for suppliers, or to discourage or limit their use.
Despite the fact that governments routinely use price controls, most economists generally condemn the use of price controls, believing that price controls do not accomplish what is intended. As such, many economists hold the position that price controls should never be used.
Important Terms
To understand price controls, there are a few important terms that need to be understood:
- Equilibrium Point
The intersection points of the supply curve and the demand curve is the equilibrium, or market-clearing price. This is a theoretical economic state where markets are the most efficient, as it means that there is no surplus supply or unmet demand.
- Consumer Surplus
Difference between what the buyer paid for a good or service versus what the buyer was willing to pay for said good or service.
- Producer Surplus
Difference between the price at which a producer is willing to bring a good or service to market versus the price the supplier did bring said good or service for.
- Deadweight Loss
The volume of market activity which would have happened had the government not intervened.
Quota#
A quota is a price control which sets a hard limit on the amount of supply for a certain good. Quotas are typically set when governments want to control the sale of demerit goods such as alcohol, cigarettes, marijuana, etc.

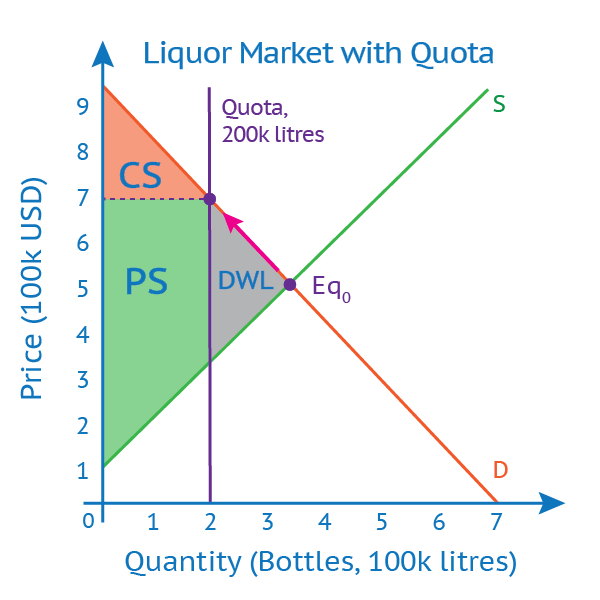
The above graph is a hypothetical scenario which depicts a quota set on the liquor market. Initially, the equilibrium point (\(Eq_0\)) is at $500K, with the quantity supplied and quantity demanded both at 350K liters. However, once the quota is set at 200K liters, the quota on supply means that producers can now charge the price increased from $500K to $700K, as the limited supply means that producers could now as the demand for the good increases due to its scarcity.
In the graph above, the orange area represents consumer surplus (CS), the green area represents producer surplus (PS), and the gray area represents deadweight loss (DWL). Since the new price is above market value, producer surplus increases due to the higher profit margins. Consumer surplus decreases, as the product has become less affordable. The deadweight loss represents the volume of market activity that would have happened if the government did not intervene, as the quota on supply means that not all demand in the market is met.
Price Ceiling#
A price ceiling, or a price cap, is a price control which sets a maximum price at which a particular good could be sold at. Governments typically use price ceilings in order to control the inflation of prices of a certain good. It is one of the most common form of price control.

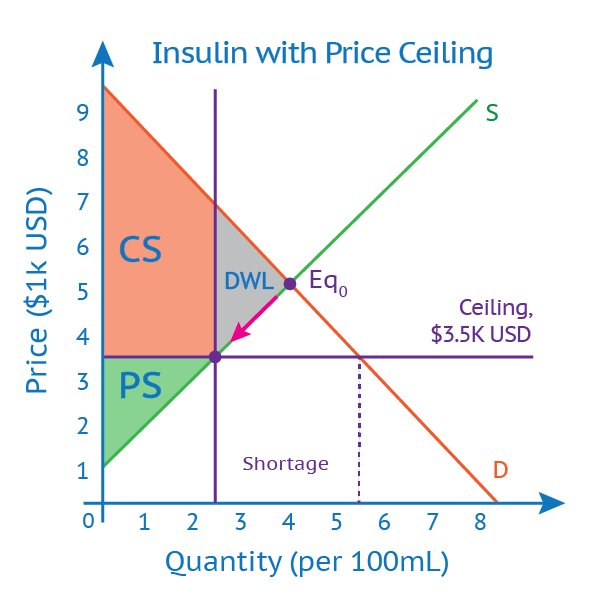
The above graph is a hypothetical scenario which depicts a price ceiling on the insulin market. Initially, the equilibrium point (\(Eq_0\)) is at $5K, with the quantity supplied and quantity demanded both at 400mL. However, once a price floor is set at $3.5K, this causes the supply to decrease from 400mL to 250mL, as it becomes less profitable for suppliers to create this product. Demand increases from 400mL to 550mL, as people who were previously unable to afford the product are now able to. In other words, there is a shortage of supply.
In the graph above, the orange area represents consumer surplus (CS), the green area represents producer surplus (PS), and the gray area represents deadweight loss (DWL). Since the new price is below market value, producer surplus decreases, as it becomes less profitable for producers to produce the product. Consumer surplus increases, as the product becomes more affordable. The deadweight loss represents the volume of market activity lost due to supply being unable to meet the demand.
To fix the supply-demand imbalance in the long run, the government could, for example, increase supply by subsidizing or investing in suppliers so that they could increase their production output. This would shift the supply curve to the right, which would reduce the shortage between supply and demand.
Note
Price ceilings are only binding when the ceiling is below the equilibrium point, since no demander will buy a product above market value.
Price Floor#
Price floors is a price control which sets a minimum price at which a particular good could be sold at. Governments usually set price floors when there is a lack of unique suppliers, and they want to discourage anticompetitive behavior, as such behavior could result in the lack of consumer choices or even unreasonable prices. Another reason for setting price floors is to discourage the sale of certain products viewed as harmful.

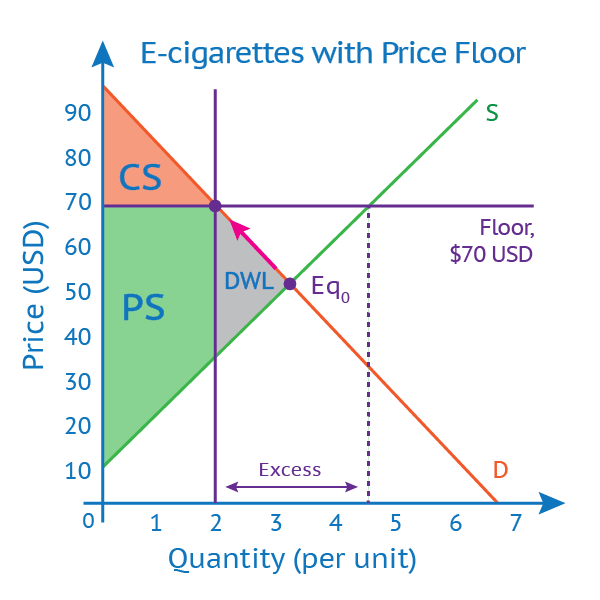
The above graph is a hypothetical graph which depicts a price floor on the e-cigarette market. Initially, the equilibrium point (\(Eq_0\)) of the graph is at $50, with the quantity supplied and quantity demanded both approximately at 3.2 units. However, once a price floor is set at $70, it creates an imbalance. The higher price increases the supply from 3.2 units to 4.5 units due to its now higher profit margins, which incentivizes producers to produce more of the product. Demand decreases from 3.2 units to 2 units, as people who were originally able to afford the product now cannot afford it. In other words, there is an excess of supply.
In the graph above, the orange area represents consumer surplus (CS), the green area represents producer surplus (PS), and the gray area represents deadweight loss (DWL). Since the new price is above market value, producer surplus increases because it is now much more profitable for suppliers to sell the good, and consumer surplus decreases due to the significant increase in price. The deadweight loss represents the volume of market activity lost due to reduced demand.
To fix the supply-demand imbalance in the long term, one must either shift supply and/or demand so that they meet and form a new equilibrium. There are many ways which this can be achieved. This can be left up to the market, for example, where supply will steadily drop to meet demand. Firms could also find ways to increase demand by doing things such as advertising.
Note
Price floors are only binding when the floor is above the equilibrium point, since no supplier will sell a product below market value.
Specific Tax#
A specific tax is a fixed amount of tax that is placed on the producer which is added on every unit of produce. Typically, this tax is passed partly to the consumers in the form of a higher price. Unlike an ad valorem tax, such as a percentage tax, specific taxes are clear-cut. Typically, governments impose specific tax in order to collect the money they need to operate.

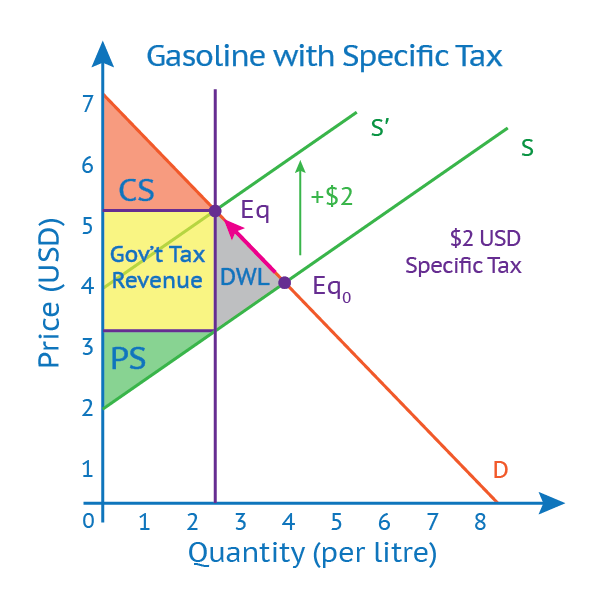
The above graph is a hypothetical graph which depicts a specific tax on the gasoline market. Initially, the price at equilibrium (\(Eq_0\)) is $4, with the quantity supplied and quantity demanded both at 4 liters. Once the specific tax of $2 is imposed on the sale price of gasoline, the supply moved 2 units up. Unlike the other price controls mentioned above, a specific tax does not create an imbalance in supply and demand. Instead, the supply curve shift results in a new equilibrium point (\(Eq\)). In this example, the new equilibrium point is at $5.20 with quantity demanded and quantity supplied both at 2.5 liters. Note that a $2 tax does not necessarily mean a $2 increase in price, as the tax is shared between producers and consumers.
In the graph above, the orange area represents consumer surplus (CS), the green area represents producer surplus (PS), the yellow are represents government tax revenue and the gray area represents deadweight loss (DWL). In this case, both consumer and producer surplus decreases, as the government tax eats into both of surpluses. The deadweight loss represents the volume of market activity lost due to the specific tax being levied.
See also